 - fractional citation tool
Some statistics
fCite is based on PubMed database (via iCite). fCite is updated monthly (approx. third day of the month).
- fCite covers the years 1962 through 2025 (note that the data for items older than 1995 are fragmentary).
- fCite can use PMIDs and/or ORCIDs. The publications of ORCID users are retrieved annually around November. Although, the ORCID data in 2018 corresponded to 5,380,983 scientists and 19,516,285 publications, it is highly recommended to use PMIDs (extracted manually from PubMed as described in Help) because the lists of the publications in ORCID are often incomplete (most of the authors provided fewer than five publications and only a few have more than 500 which is generally quite unrealistic). Moreover, most of the items in ORCID have DOIs instead of the PMCs and PMIDs used by fCite (among those 19.5 M articles, PMIDs are included in 13.24%, PMC in 3.24% and DOIs in 97.85% of cases). It must be stressed that having a DOI does not mean that a given item will be found in PubMed. We have done a mapping of DOI to PMIDs, but the information in PubMed XMLs is partial (in 2018 from all 19.5M articles in ORCID we could map 7.7M to PMIDs). Therefore, it is recommended to extract PMIDs manually (see Help section).
fCite data update statistics
As mentioned earlier fCite is updated monthly. Below some statistics:fCite size Timestamp 30,653,284 2019 03 30,990,593 2019 06 31,078,133 2019 09 31,697,457 2019 12 31,982,004 2020 03 32,473,615 2020 06 32,870,615 2020 09Conclusions:
- the number of publications in fCite grows by ~100k per month
ORCID data update statistics
The percentiles are updated annually using ORCID_Public_Data_File_YYYY snapshots. Below some statistics:
                        2020           2019           2018
All ORCIDs:           9,747,030      7,315,273      5,380,983
Parsable to json:     9,747,030      7,314,172      5,375,690
Empty:                7,393,589      5,649,328      4,217,452
With works:           2,353,441      1,664,844      1,158,238
With valid works:     1,230,176        770,468        600,755
Total publications:  49,600,193     26,210,542     19,516,285
PMID publications:   15,497,833      9,965,050      7,707,761
Avg. pub per ORCID:     12.6           12.9            12.8
Conclusions:- the average number of publications per portfolio is stable
- the number of publications in ORCID grows very fast
- ORCID user number doubled in last two years (with 1.23Mi of users with at least one work in PUBMED)
- around 1/3 of the publications in ORCID are also indexed in PUBMED/fCite
Details on the percentile calculation of the citation and RCR scores
The total citation counts, RCR scores and their derivatives (e.g., FLAERCR, ECRCR) are accompanied by so-called "percentiles" that help to assess the meaning of the score.
For simplicity, let us consider a hypothetical portfolio of 10 papers that got in total 100 citations and RCR=5.
For simplicity, let us consider a hypothetical portfolio of 10 papers that got in total 100 citations and RCR=5.
Author: John Smith (10 articles)
Published between 2013-2018 (6 years)

No. Year    Cit    RCR
1.  2013     17    0.6
2.  2013     20    0.5
3.  2014      1    0.1
4.  2016     15    0.7
5.  2016      7    0.3
6.  2017     31    2.3
7.  2017      5    0.2
8.  2017      2    0.1
9.  2017      1    0.1
10. 2017      1    0.1
Sum         100    5.0
Is this good or not? To answer this question we need to compare those scores to some data set. In fCite, the ORCID data are used for this purpose.
As mentioned in the FAQ the problem of identifying the author is not trivial and it is actually very hard to automate if we want to be very accurate (e.g., people change surnames, and sometimes they use initials only, or use special characters not present in the English alphabet). The data from the ORCID database make the problem easier to solve, but still some care is needed (we have already seen that people have begun to game the ORCID system by adding publications not belonging to them, e.g., John Smith's records "enriched" by Jane Smith's records abbreviated by the initial only). Nevertheless, parsing out the author from the publication author list is a doable task because ORCID provides the name and surname of the user. In the simplest scenario, having "name+surname" allows us to calculate a so-called Levenshtein distance between two strings (the minimum number of single-character edits: insertions, deletions or substitutions, required to change one word into the another). This allows us to identify the potential position of a given author on the authorship list (the algorithm, of course, is not perfect, and when there is some ambiguity, e.g., two authors with perfect matches are identified, for instance two John Smiths in the list, then the record is not taken into considerations).
If none of the authors match the ORCID names and surnames, then a slightly more complicated procedure is used:
- a set of possible names and surnames is generated from ORCID's 'name'+'surname' i.e. ([name+' '+ surname, surname+' '+name, name[0]'+' '+surname, surname[0]+' '+name, name[0]'+' X '+surname, surname[0]+' X'+name]). Remark: all names and surnames are case insensitive because people frequently mix/overuse capital letters)
- for a given set a Jaro–Winkler distance is calculated for all authors and, then normalized, and the one with the highest score (which must be above 0.65) is chosen
As a result, the average portfolios used to calculate the fractional versions of metrics are usually shorter than the original portfolios (those for which the author position could not be identified with high probability). Consequently, the percentiles presented in fCite for fractional metrics can be considered overly optimistic. For instance, the 95th percentile could actually be the 90the percentile. However, currently, better data do not exist, and those estimates will be more accurate than comparing such scores by eye. Moreover, the percentile thresholds are updated yearly when new ORCID data appear.
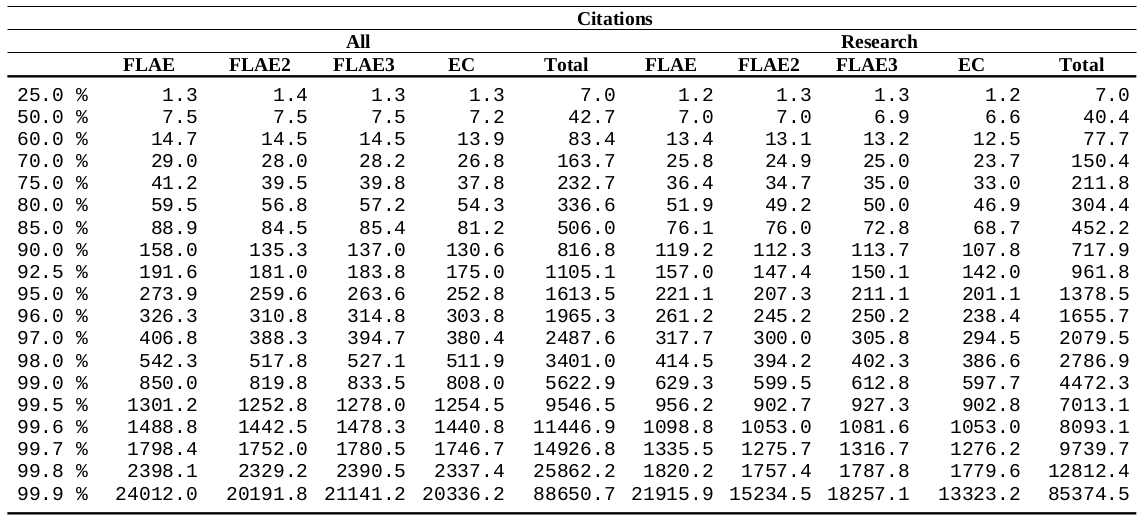
Below, you can find detailed data for given percentiles depending on the score and the type:
Note: the score must be > 0 (this is an important remark because ~1/4 of the records have RCR, citations, etc. equal to 0, which means that
they did not (have time yet to) show any importance), and the ORCID portfolio
must contain at least one item assigned to the author with a >0.65 Jaro–Winkler distance.
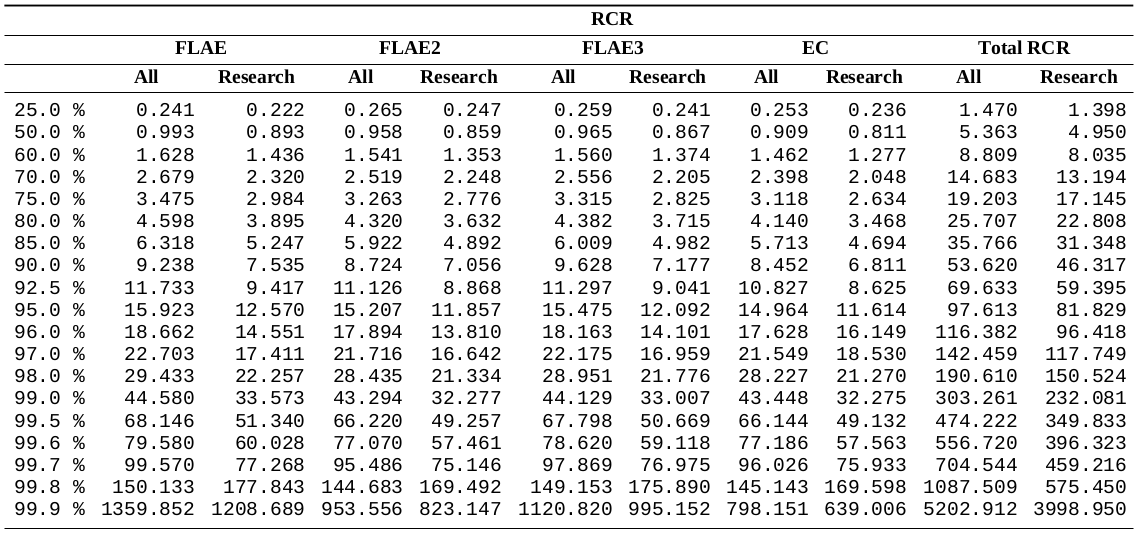
Returning to John Smith, 100 citations and a RCR of 5 gives him:
Now, let us divide the publications in the ORCID portfolio into four categories:
Conclusions:
Now let us check how this changes across the number of items in the portfolio. It is expected that smaller portfolios (most likely younger researchers at the beginning of their careers, aka PhD students, postdocs) will have more first author publications than people with dozens of publications (principal investigators). The raw data for the plots below are available here and here.
Conclusions:
Research vs. non-research items in the period 1995-2018 (based on 17,787,016 PMIDs) (the raw format)
Conclusions:
As mentioned in the FAQ the problem of identifying the author is not trivial and it is actually very hard to automate if we want to be very accurate (e.g., people change surnames, and sometimes they use initials only, or use special characters not present in the English alphabet). The data from the ORCID database make the problem easier to solve, but still some care is needed (we have already seen that people have begun to game the ORCID system by adding publications not belonging to them, e.g., John Smith's records "enriched" by Jane Smith's records abbreviated by the initial only). Nevertheless, parsing out the author from the publication author list is a doable task because ORCID provides the name and surname of the user. In the simplest scenario, having "name+surname" allows us to calculate a so-called Levenshtein distance between two strings (the minimum number of single-character edits: insertions, deletions or substitutions, required to change one word into the another). This allows us to identify the potential position of a given author on the authorship list (the algorithm, of course, is not perfect, and when there is some ambiguity, e.g., two authors with perfect matches are identified, for instance two John Smiths in the list, then the record is not taken into considerations).
If none of the authors match the ORCID names and surnames, then a slightly more complicated procedure is used:
- a set of possible names and surnames is generated from ORCID's 'name'+'surname' i.e. ([name+' '+ surname, surname+' '+name, name[0]'+' '+surname, surname[0]+' '+name, name[0]'+' X '+surname, surname[0]+' X'+name]). Remark: all names and surnames are case insensitive because people frequently mix/overuse capital letters)
- for a given set a Jaro–Winkler distance is calculated for all authors and, then normalized, and the one with the highest score (which must be above 0.65) is chosen
As a result, the average portfolios used to calculate the fractional versions of metrics are usually shorter than the original portfolios (those for which the author position could not be identified with high probability). Consequently, the percentiles presented in fCite for fractional metrics can be considered overly optimistic. For instance, the 95th percentile could actually be the 90the percentile. However, currently, better data do not exist, and those estimates will be more accurate than comparing such scores by eye. Moreover, the percentile thresholds are updated yearly when new ORCID data appear.
Below, you can find detailed data for given percentiles depending on the score and the type:
| Research only items | All (research and non-research items) | |||||||||
| FLAERCR | FLAE2RCR | FLAE3RCR | ECRCR | total RCR | FLAERCR | FLAE2RCR | FLAE3RCR | ECRCR | total RCR | |
| FLAEcit | FLAE2cit | FLAE3cit | ECcit | Citations | FLAEcit | FLAE2cit | FLAE3cit | ECcit | Citations | |
Note: the score must be > 0 (this is an important remark because ~1/4 of the records have RCR, citations, etc. equal to 0, which means that
they did not (have time yet to) show any importance), and the ORCID portfolio
must contain at least one item assigned to the author with a >0.65 Jaro–Winkler distance.
Returning to John Smith, 100 citations and a RCR of 5 gives him:
                RCR  Citation
                  5     100
Research only  50.2    63.8
All            48.5    62.7
Now, let us divide the publications in the ORCID portfolio into four categories:
+---+--------------+---------------+----------------+----------------+
|   |    Single    |     First     |     Middle     |      Last      |
+---+--------------+---------------+----------------+----------------+
|   | 128455+-1207 | 1427848+-3213 | 3964752+-11425 | 1487607+-6908  |
| % | 1.833+-0.016 | 20.373+-0.044 |  56.569+-0.059 |  21.225+-0.059 |
+---+--------------+---------------+----------------+----------------+
Authorship patterns for 572,910 ORCID users having at least one publication above the cut off (7,008,012 unique publications in total).
The mean and standard deviation were calculated by bootstrapping the data 1000 times, and the Jaro–Winkler distance >0.65 was used as a cut-off.
Conclusions:
The mean and standard deviation were calculated by bootstrapping the data 1000 times, and the Jaro–Winkler distance >0.65 was used as a cut-off.
Conclusions:
- In most research publications, the researcher is a middle author (57% of cases)
- Every fifth publication is either a first or last author contribution
- Single author research publications are extremely rare
+---+------------+--------------+--------------+--------------+
|   |   Single   |    First     |    Middle    |     Last     |
+---+------------+--------------+--------------+--------------+
| % | 1.54+-5.03 | 21.07+-15.49 | 58.00+-20.70 | 19.40+-18.57 |
+---+------------+--------------+--------------+--------------+
Conclusions:
- The means are very similar in both tables
- There is substantial variance in what can be considered normal (on the other hand, this type of information can be used to statistically judge whether given portfolio is enriched or depleted by given types of publications, e.g., a portfolio having 40% of first author papers is quite unexpected)
Now let us check how this changes across the number of items in the portfolio. It is expected that smaller portfolios (most likely younger researchers at the beginning of their careers, aka PhD students, postdocs) will have more first author publications than people with dozens of publications (principal investigators). The raw data for the plots below are available here and here.

All articles |
Research only articles |
|---|
- As hypothesized above, we clearly see that the more publications there are in the portfolio, the fewer first author publications there are in the portfolio (and the opposite is true for the last author publications). This simply reflects that at some point in time, a successful scientist becomes the head of the lab/group leader/principal investigator, and then she/he ends up in the last position on the author list as a corresponding author. *
- The percentage of single and middle author publications is fairly stable across the lifetime of the researcher (~2% and ~60%).
- The standard deviation for first, last and middle author publications can be as high as ~20% which means that there is considerable variance, but still as mentioned above, a portfolio having 40% of first author papers is quite unexpected.
- "The tipping point" at which the proportion of first and last author publication is similar at ~27-31 papers. If we consider that last author papers are a sign of creating a new laboratory or beginning to become an independent researcher, on average ~30 item portfolios already have six first and six last author publications.
- Single author papers are very rare (additionally, it is more likely that single author papers will be non-research articles, for instance, an editorial, comment, or review, rather than a research paper).
- On average, there are more middle author papers in the research only fraction, which again is expected because research papers have more authors on average; (un)surprisingly, it seems that writing non-research items requires fewer authors.
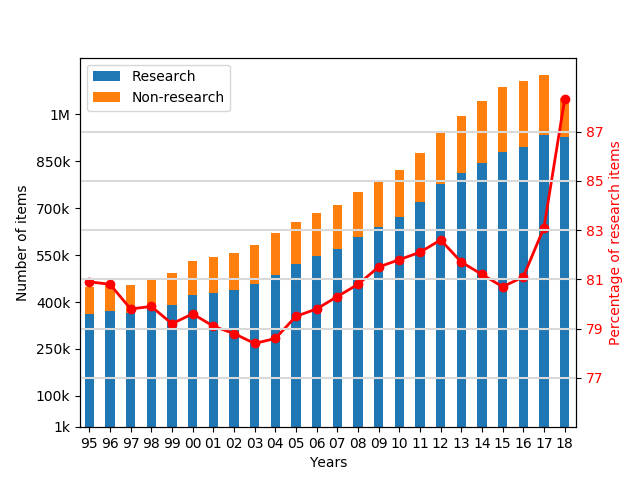
Number of research vs. non-research publications in PUBMED since 1995
Research vs. non-research items in the period 1995-2018 (based on 17,787,016 PMIDs) (the raw format)
- The number of publications in PUBMED grows every year (it doubled in last 25 years)
- Most of the publications are "research" items, and they constitute ~80% of portfolios
Number of authors vs. research_non-research items
It is very interesting to also investigate the number of authors for individual papers. This may differ across fields of science (e.g., in mathematics, publications usually tend to have fewer authors than in medicine); nevertheless, it is crucial to analyse such patterns. We can try to answer a number of questions. For instance, how many authors does the average paper have? What is the fraction of papers for single author, two author, or three author papers? Is there any relationship between the number of authors and type of publication (research vs. non-research)?
Conclusions:
Conclusions:
Conclusions:
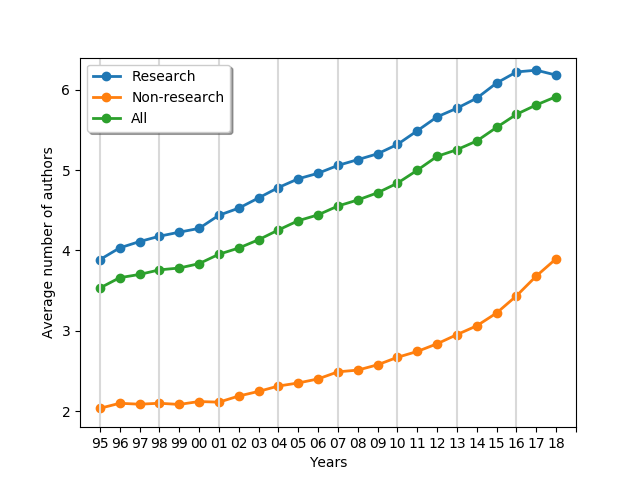
- The average number of authors increased over time from 3.5 in 1995 to 5.9 in 2018
- The average number of authors for research papers is constantly larger than for non-research papers (by approx. two authors)
- The average non-research paper in the 1990s had 2 authors, while now it has 4 authors per paper
- The average research paper in the 1990s had 4 authors, while now it has over 6 authors per paper
Conclusions:
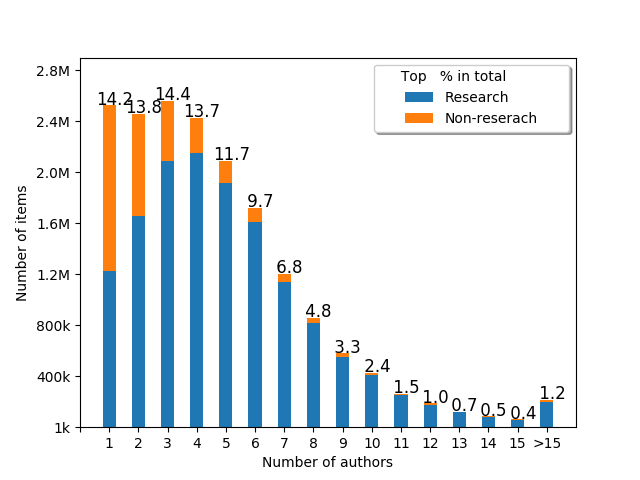
- Most of the research papers have less than 10 authors (usually 3-5 authors), with a long tail of the papers authored by >15 people
- Over half (51.4%) of single author papers are non-research items
- The fewer authors, the more probable it is non-research paper
Conclusions:
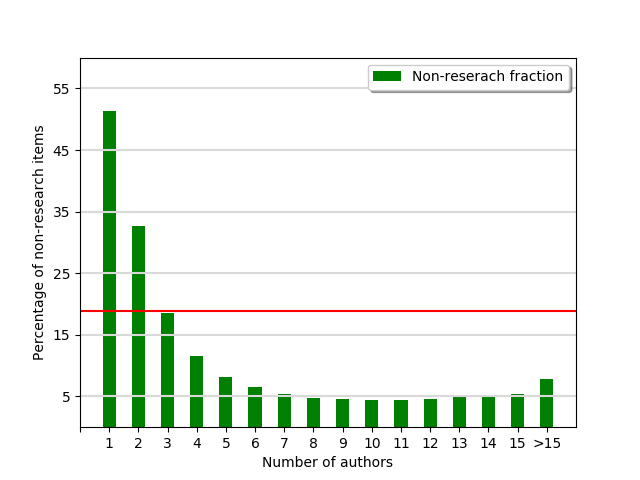
- Most of non-research papers (editorials, reviews, commentaries, etc.) are written by 1-4 persons
- A single author paper is approximately three times more likely to be a non-research work than the average (51.4% vs 18.9%)
- A ten-author paper is a than four-times more likely to be a research item than average (4.4% vs 18.9%)
Let us now check the trends over the time
Conclusions:
 Conclusions:
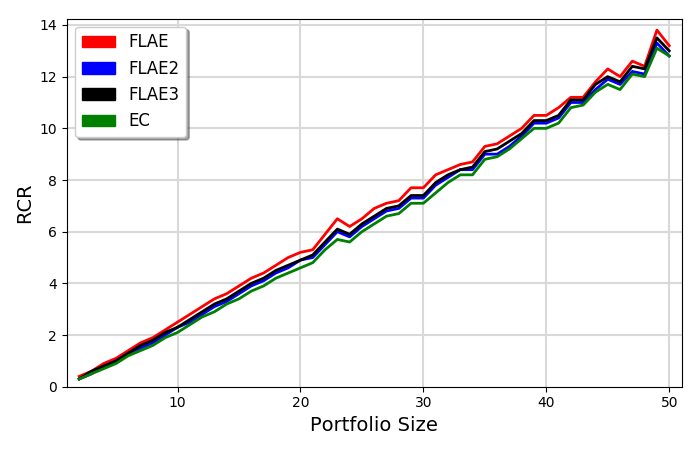
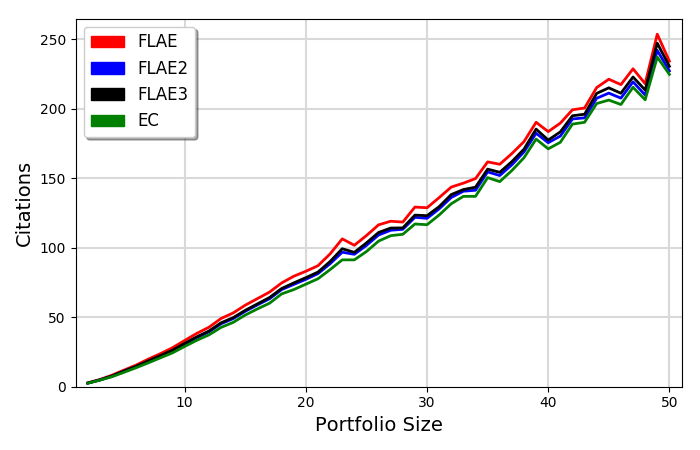
Fractional metrics vs total metrics (RCR or Citations) with respect to portfolio size
Conclusions:
The correlations of fractional models
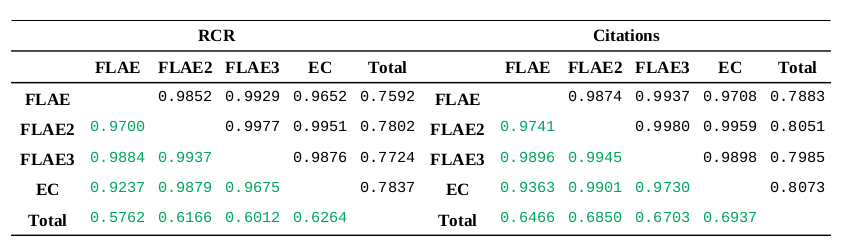
The lower triangular portion of the matrices (green) correspond to the ORCID portfolios with 2-50 items (394,189 portfolios)
and the upper triangular portion of the matrices correspond to all ORCID portfolios with at least a single item (600,755 portfolios)
Conclusions:
QUESTION: Thus, since the models are so well correlated, why should we bother considering more in the first place? Can we not just re-calculate one model to another?
ANSWER: No, you cannot, especially if you are in the business of looking for outliers. When you analyse one, particular portfolio, you can use the averages only as a baseline (no matter how good the correlations are, unless the correlation is 1.0). Actually you are looking for what is odd (e.g., ultra high FLAERCR in comparison to the portfolio size, the difference between FLAERCR and ECRCR to highlight the importance of first author papers, etc.)
Conclusions:
Conclusions:
Conclusions:
Conclusions:
- Over time, the single/fewer author papers decline relative to multiple author papers
- In 1995, the mode was a single author publication; in 2004, it was a three author publication; in 2007, it was a four author publication
- While the papers with more than 15 authors were almost unheard of in 1995, they have become increasingly popular, and in 2018 they represented 2.7% of all items (for >10 author papers, the statistics are 0.3% in 1995 vs. 9.8% in 2018)
Note that the fraction of single author publications in PUBMED overall is different than for ORCID portfolios. This can be explained by the fact that for some people or in some fields (e.g., mathematics), it is common to publish alone; thus this changes the pattern if you compare statistics between the portfolio and the global value, but the trend is the same: over time, a single item has more and more authors, and fewer and fewer publications are single authored.
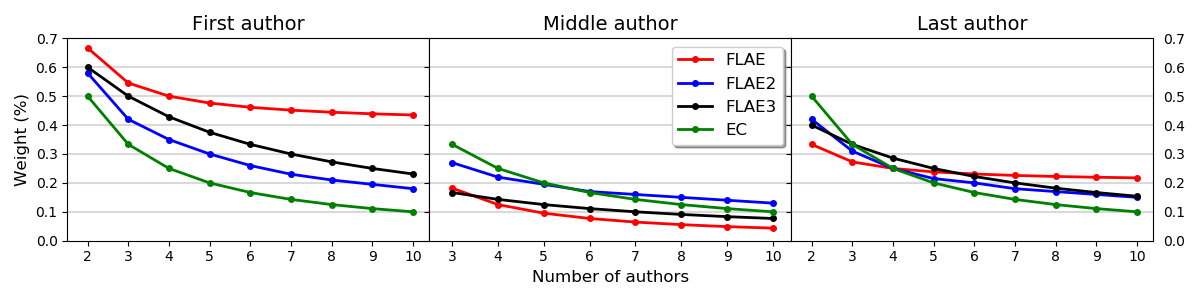
Fractional metrics (FLAE, FLAE2, FLAE3, EC)
The weights for the first, the middle and the last author up to ten authors for the FLAE, FLAE2, FLAE3, EC models.
- The FLAE model assigns the greatest importance to the first author and then later the last author
- The EC model penalises the last and first authors
- The FLAE3 model has weightings between those of the FLAE and FLAE2 models
Fractional metrics vs total metrics (RCR or Citations) with respect to portfolio size
|
|
|---|
- All models are highly correlated and produce similar results
- There is an almost linear correlation between portfolio size and the scores
- On average every 10 papers awards an RCR of ~2.5
- On average every 10 papers receives ~35-40 citations
The correlations of fractional models
The lower triangular portion of the matrices (green) correspond to the ORCID portfolios with 2-50 items (394,189 portfolios)
and the upper triangular portion of the matrices correspond to all ORCID portfolios with at least a single item (600,755 portfolios)
Conclusions:
- All models are correlated
- The fractional models are extremely positively correlated with each other (>0.9)
- The fractional models are moderately positively correlated with global metrics (RCR, citations) at ~0.6-0.8
QUESTION: Thus, since the models are so well correlated, why should we bother considering more in the first place? Can we not just re-calculate one model to another?
ANSWER: No, you cannot, especially if you are in the business of looking for outliers. When you analyse one, particular portfolio, you can use the averages only as a baseline (no matter how good the correlations are, unless the correlation is 1.0). Actually you are looking for what is odd (e.g., ultra high FLAERCR in comparison to the portfolio size, the difference between FLAERCR and ECRCR to highlight the importance of first author papers, etc.)
Look at the spreads:
|
|
|---|
- The spread among portfolios increases as portfolios became larger
- Regardless of size, the spread is always significant
- The averages are placed closer to the upper bounds, as the lower bonds are limited by zero
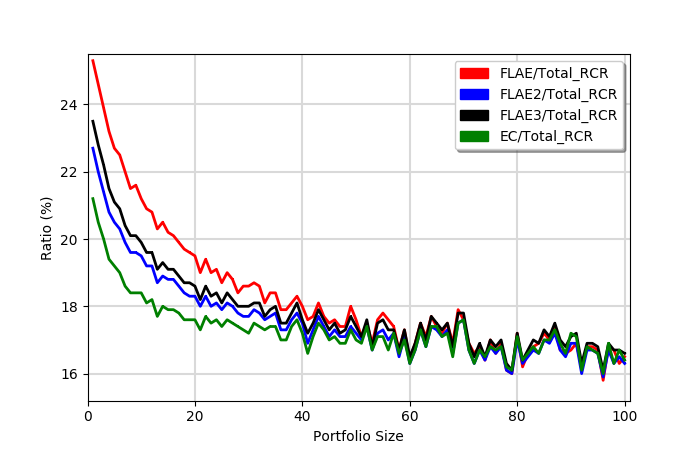
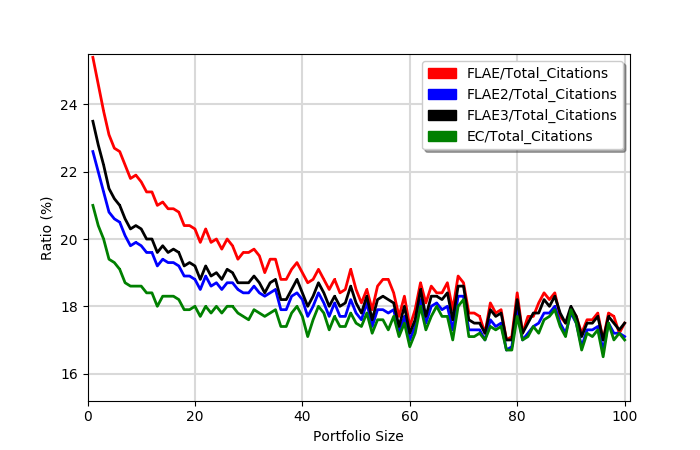
Now, let us examine the ratio of averages
RCR |
Citations |
|---|
- The ratio of any fractional model and the total score is larger for small portfolios (more first author papers)
- For portfolios with up to 10 items it is approximately 20-25%
- At approximately 40-60 items, all fractional models start to produce virtually identical results
- The ratio for RCR scores is usually lower than for citations
Next, let us take a quick look at the spreads:

RCR |
Citations |
|---|
- There is a massive spread among portfolios
- As expected, the more items there are, the smaller the spread
- Regardless of size, the spread is always at least 20%
- On average, the ratio should be approximately 18-20%, which is consistent with the average number of authors on the average paper